

Most accessed posts
Blog
Most accessed posts

.png)


Thank you! Your submission has been received!
Oops! Something went wrong while submitting the form.


.png)
.png)
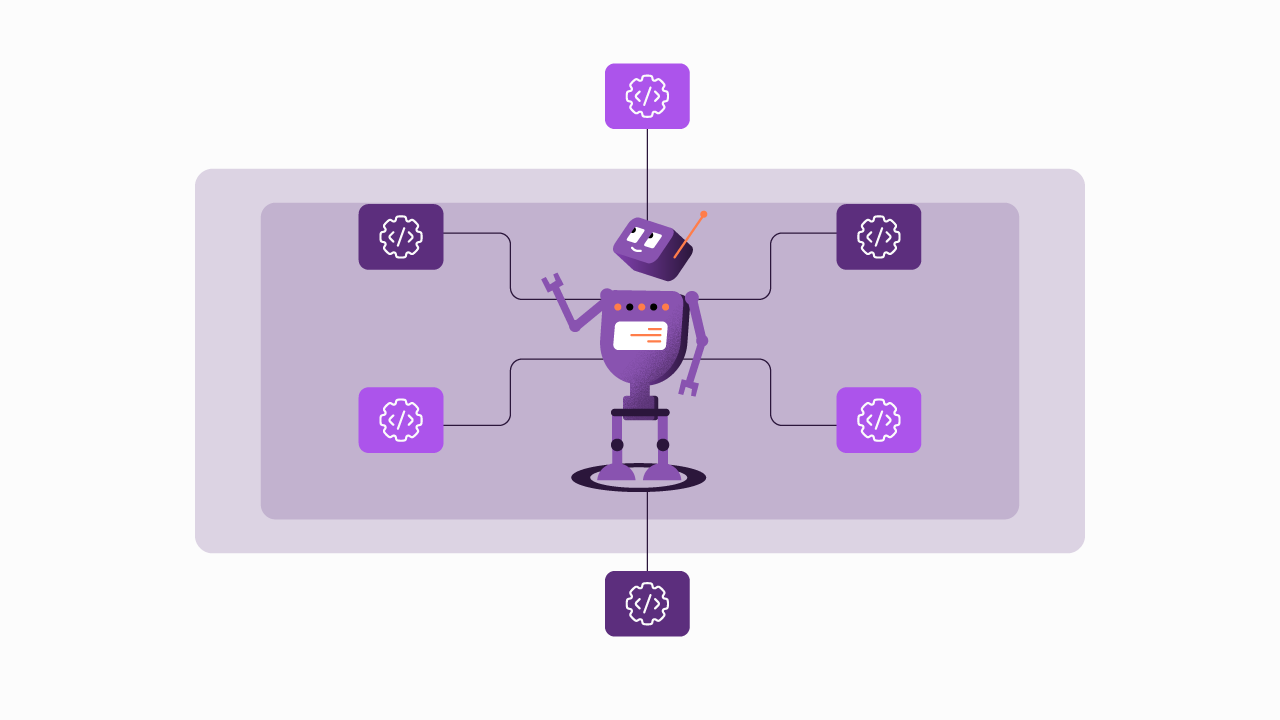
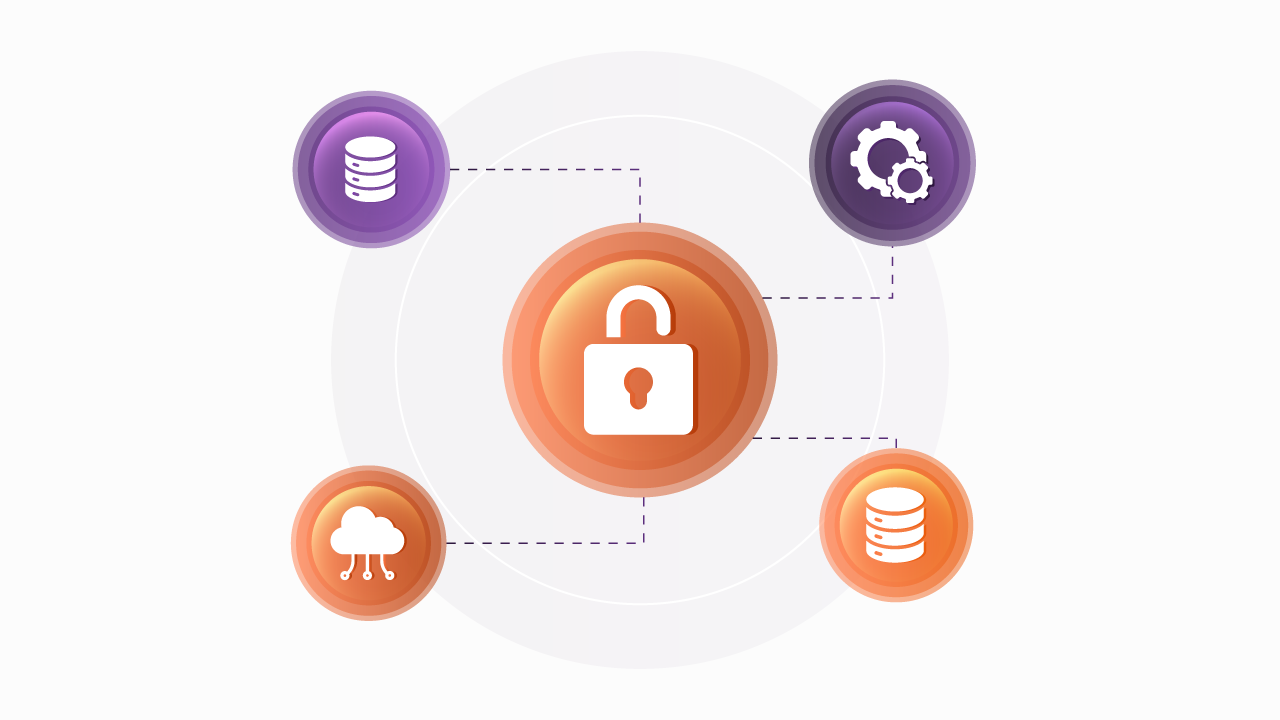
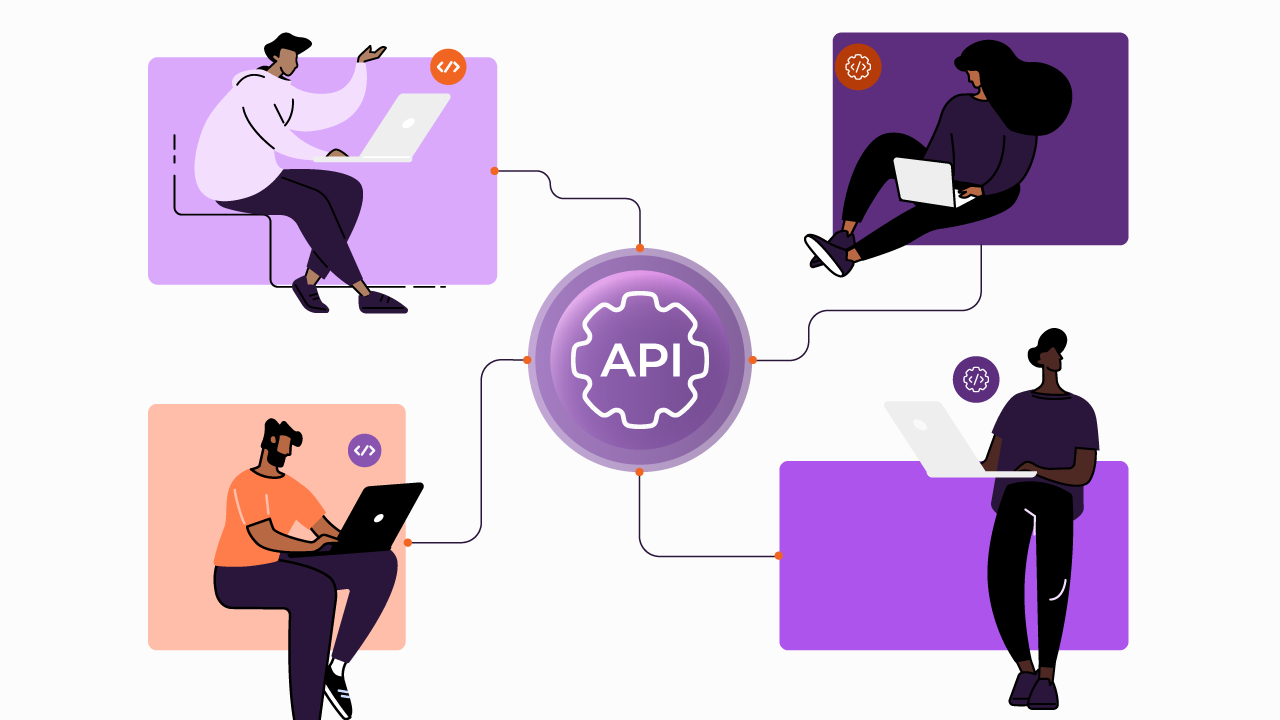
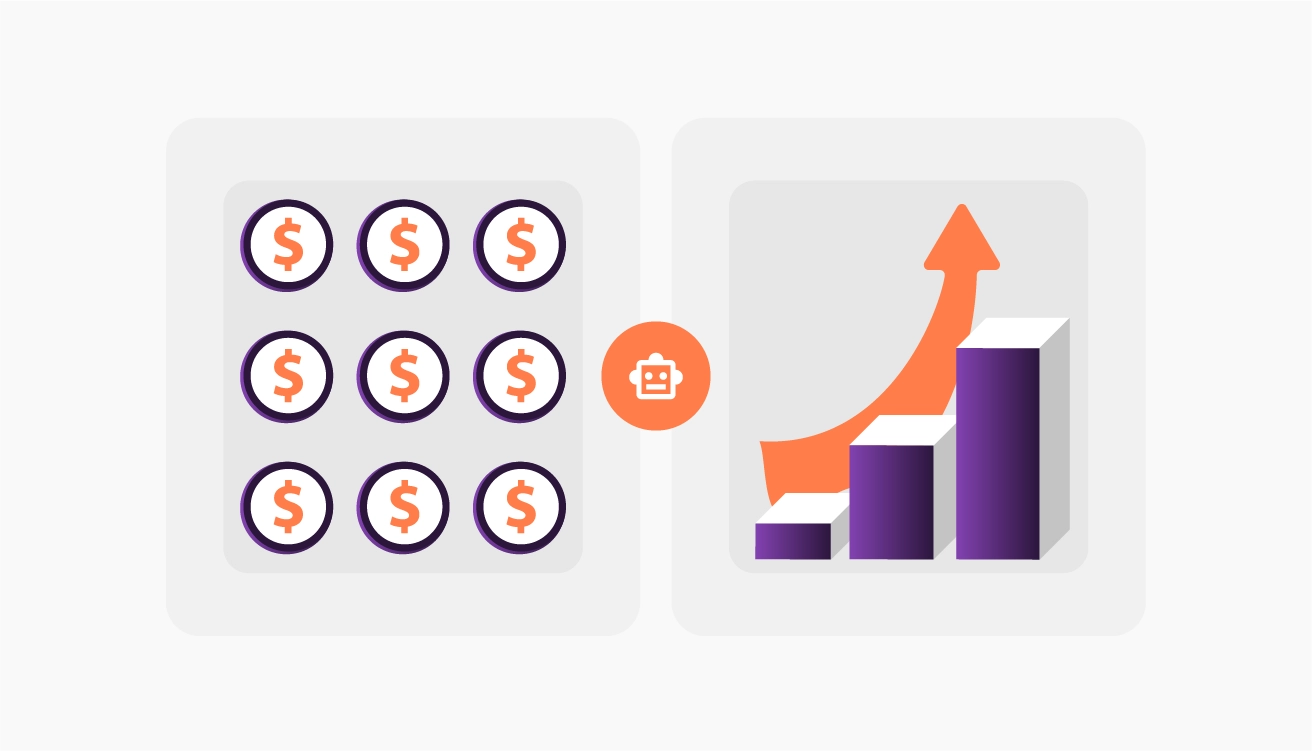
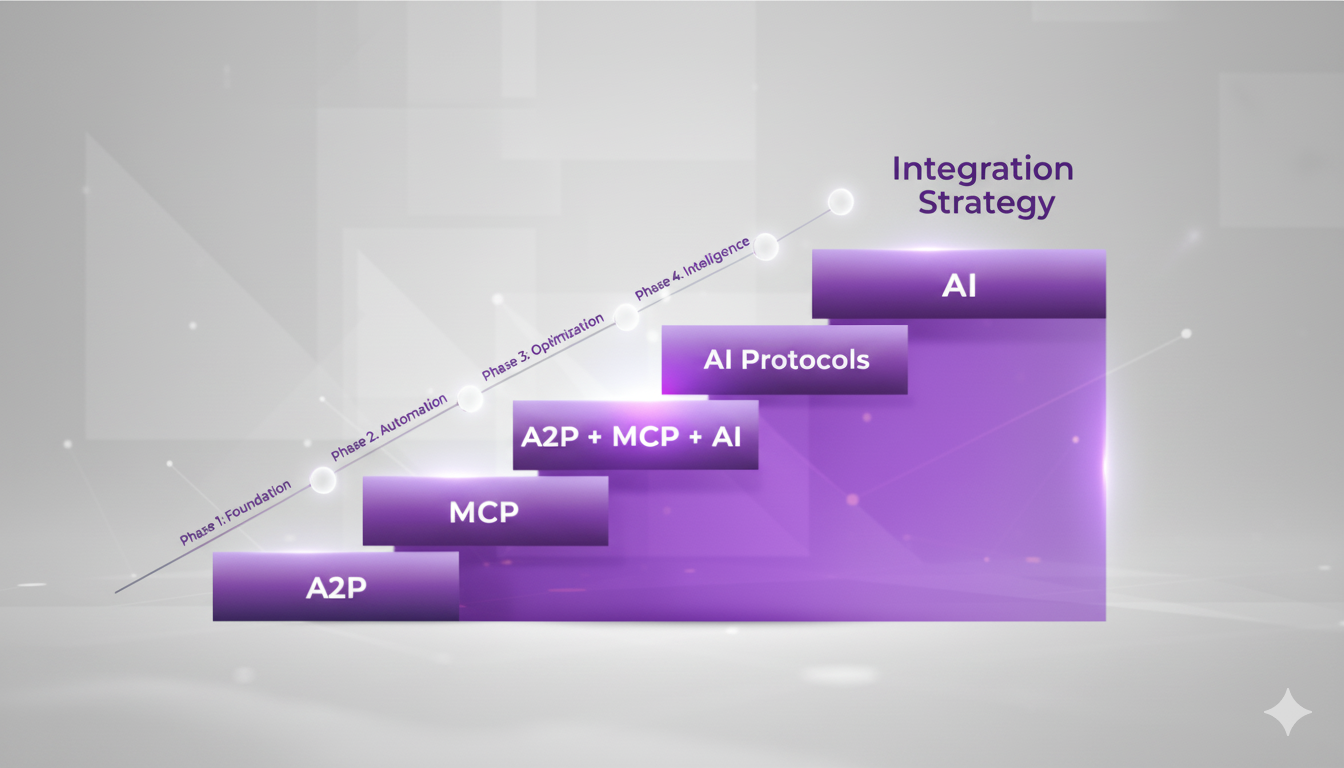
Embrace an architecture that is agile, scalable, and integrated
Accelerate the delivery of your digital initiatives through less complex and more efficient APIs, microservices, and Integrations that drive your business forward.


